The UHURU data set
- Read the excerpt of the metadata description of the UHURU data set shown in Figure 1 below.
- In the Rmd document that you created for the class, create an introductory section to your dataset.
- Describe the experimental treatment and its goal.
- Optional.- Add some images of different herbivores belonging to each treatment.
- Describe the different variables that were measured.
- add the corresponding units to the axis labels in your plots.
- Look at the graph colored by treatment, what is the influence of experimental treatment?
- What happened to the acacias in the open plots?
- Render to pdf with
knit()
.
git
add, commit and push the Rmd and the PDF files of your document.
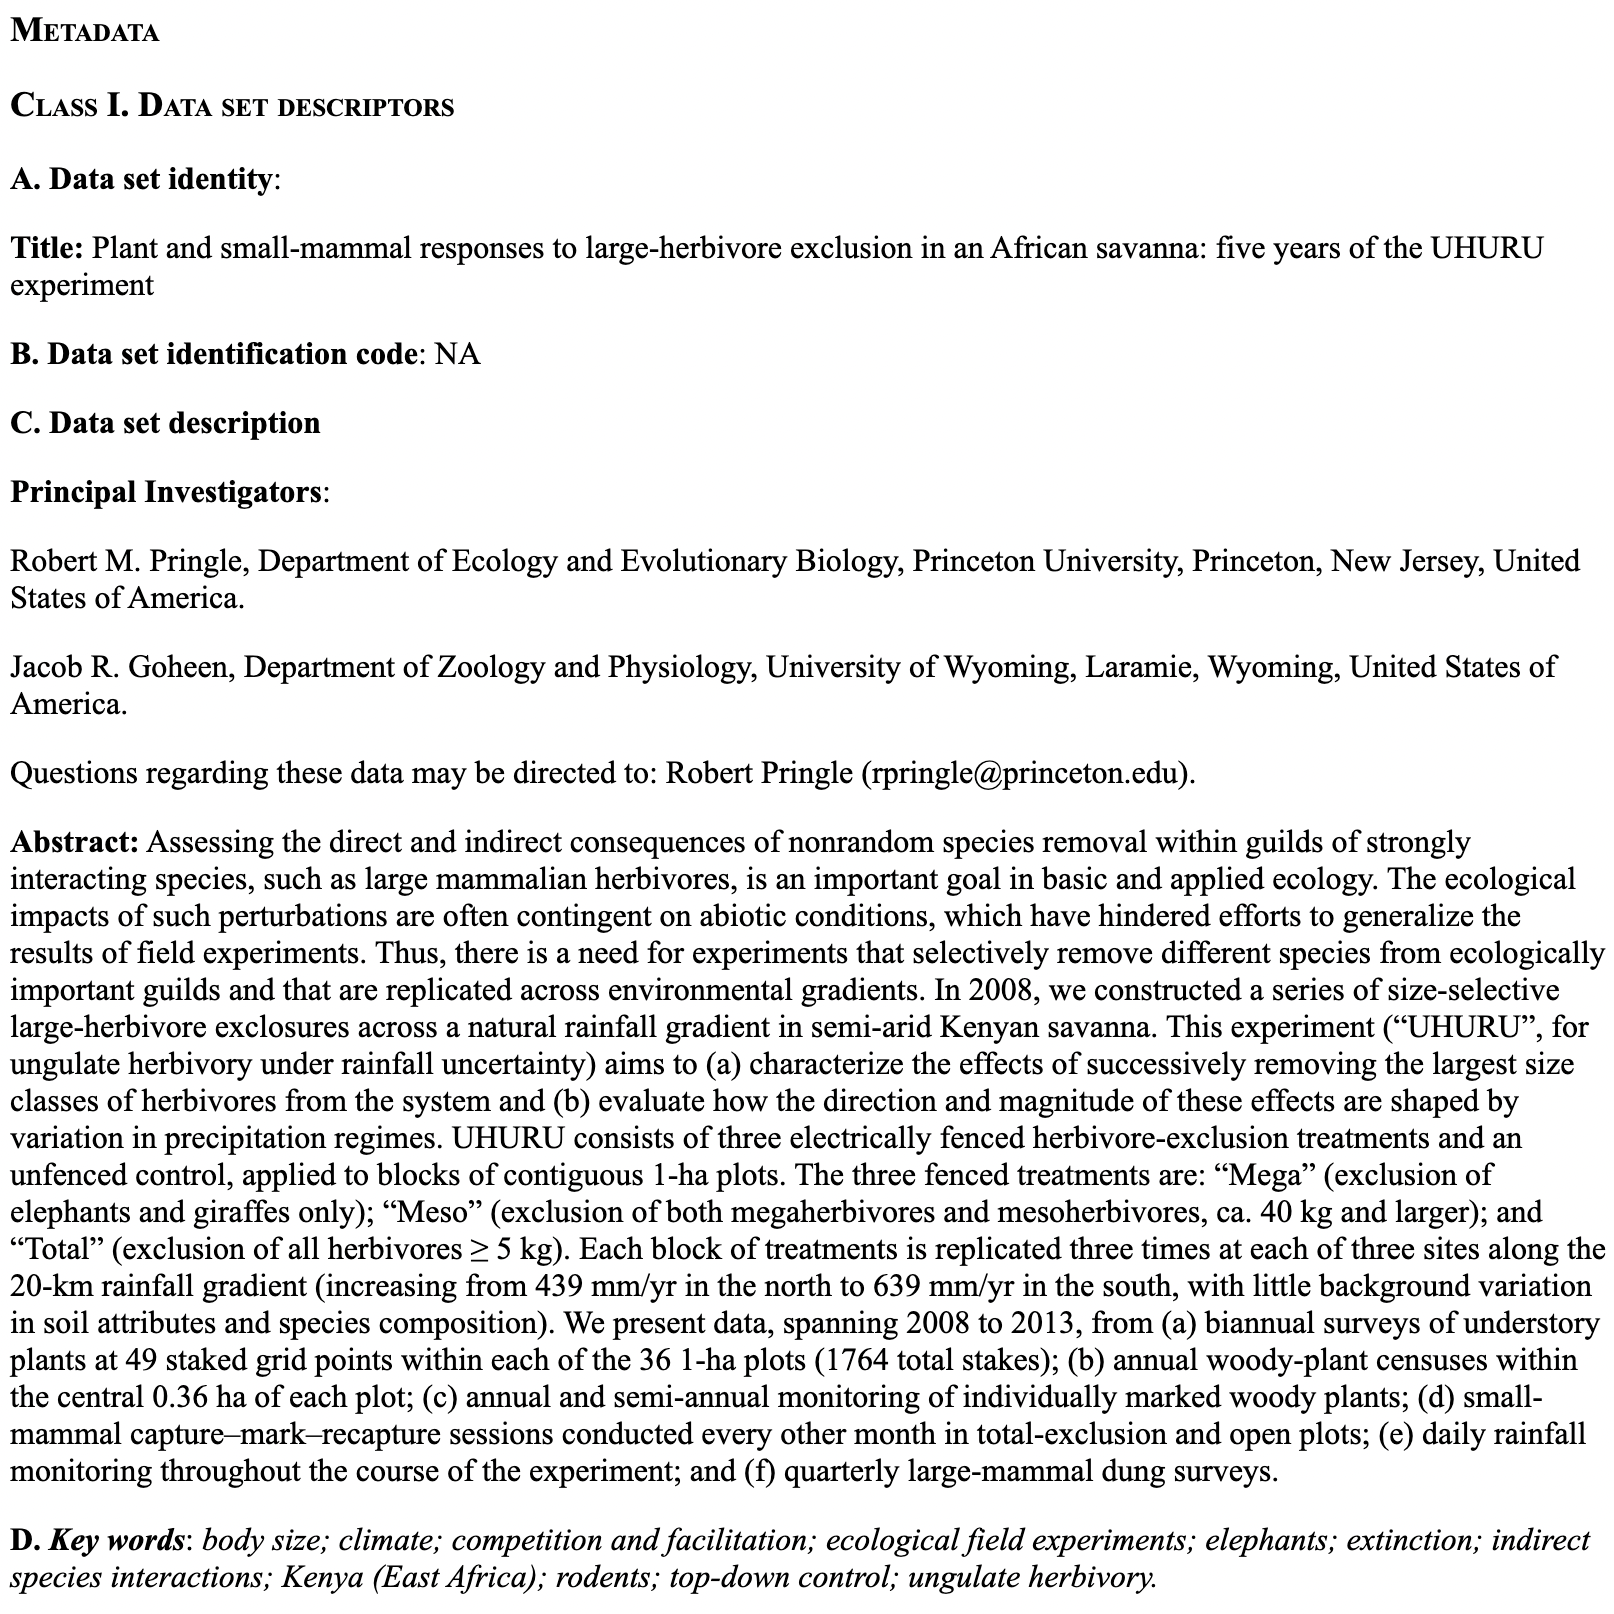
Figure 1. Snapshot of metadata from the data set analyzed in the research paper Plant and small-mammal responses to large-herbivore exclusion in an African savanna: five years of the UHURU experiment, by Kartzinel et al. 2014, published in the journal Ecology.