
Plotting a phylogeny with the package ggtree (5 min)
Installing the package ggtree (10 min)
ggtreeis an extension of theggplot2package, developed specifically for phylogenetic tree visualization- The author has made available an extensive book with examples
ggtreeis hosted in Bioconductor (not CRAN.- do
length(available())if you want to know the number of R packages available for installation, both from CRAN and Bioconductor - “CRAN hosts over 15000 packages and is the official repository for user contributed R packages. Bioconductor provides open source software oriented towards bioinformatics and hosts over 1800 R packages”, from An Introduction to R
- Bioconductor Vs CRAN
- The function
install.packages()that we know well only workf for CRAN packages - To install an R package from Bioconductor, use the function
install()from the packageBiocManager:- Install
BiocManagerfrom CRAN withinstall.packages("BiocManager") - Then install
ggtreefrom Bioconductor withBiocManager::install("ggtree")
- Install
Exercise 1
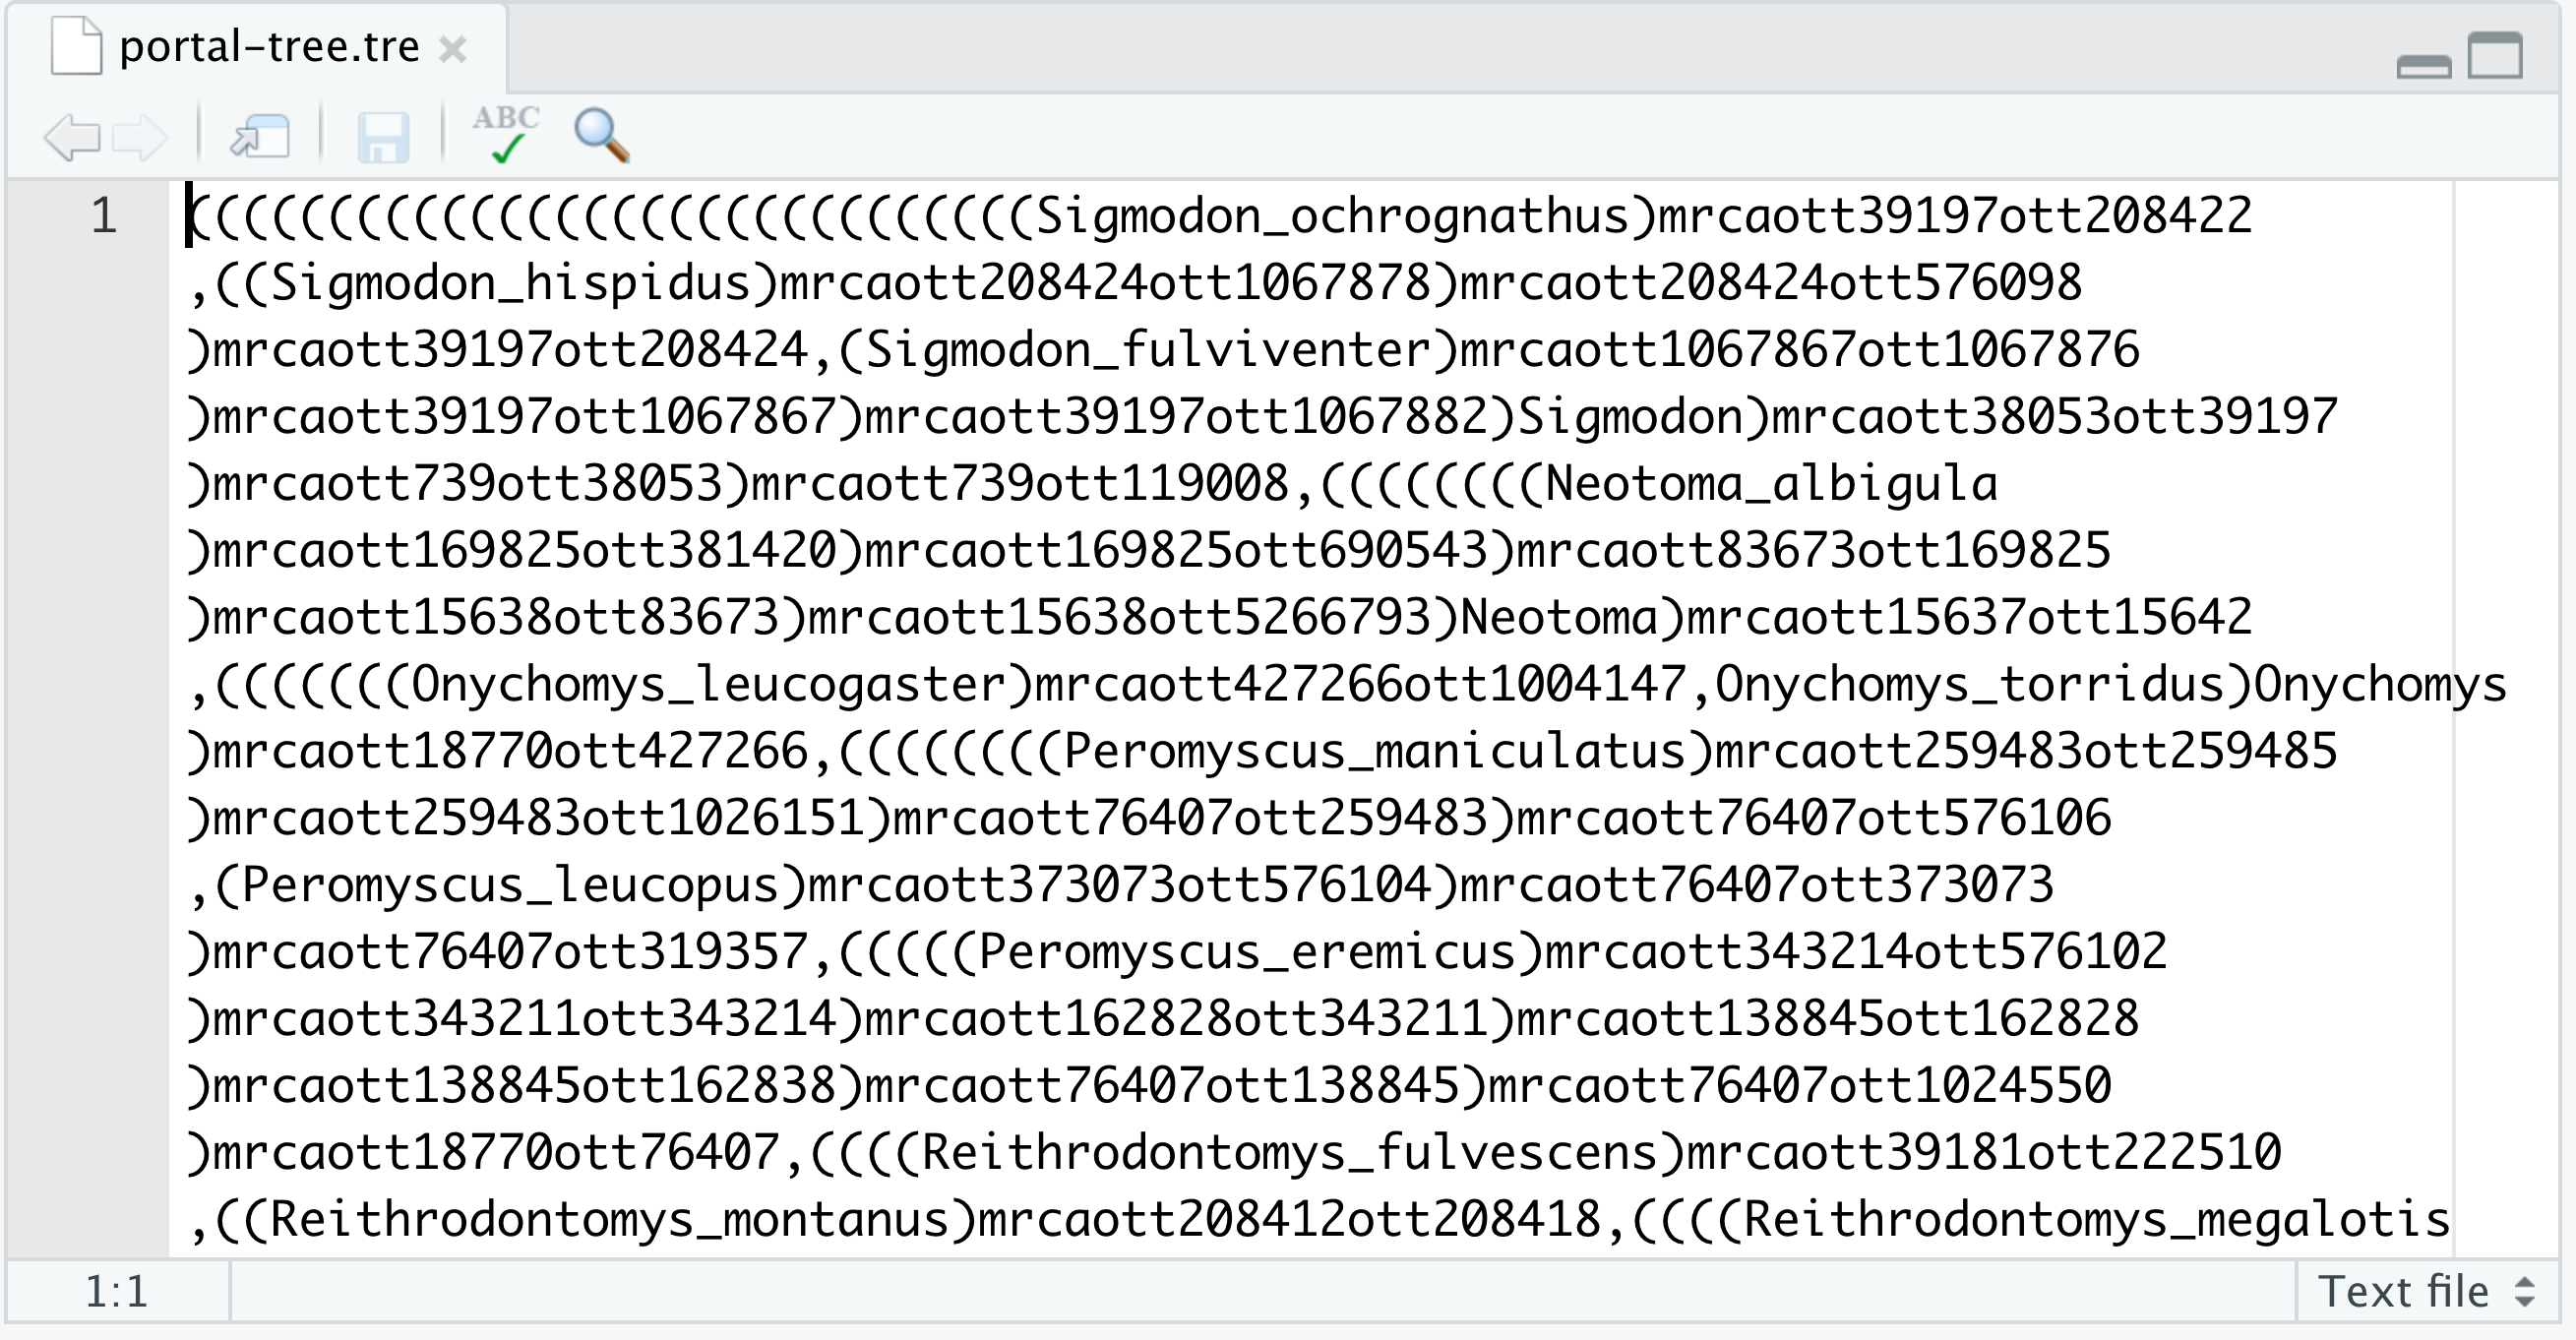
- Download this phylogenetic tree of species from the Portal Project Teaching Database, by clicking on the link and saving it to your data-raw folder.
- Open the file by clicking on its name on the Files tab of RStudio’s Plots pane. It should look like this:
- Use the main function of the package
ggtree(it is also calledggtree()) to visualizeportal-tree.tre:ggtree(portal_tree) - What differences can you note between a
ggtree()plot and one generated withplot.phylo()?
The phylo class structure (10 min)
- Type the name of the tree you just created and look at the output
- What information is printed to screen?
- Use functions to explore the structure of the objects you just created:
class(portal_tree),portal_treeis an object of class"phylo"length(tree), it has length 4names(tree), and it has names- Just as with data frames, we can access the named elements of a
"phylo"object using the dollar sign$portal_tree$edge,class(portal_tree$edge)portal_tree$Nnode,portal_tree$tip.labelportal_tree$node.label
str(tree), shows a summary of the elements of the"phylo"objecttypeof(tree), the"phylo"class is an object of type"list"
- 🎗️ classes and types are data structures that R uses to store/extract information
- a
"list"is a data type (or object type), that can hold one or more objects of different types. - the class
"phylo"is a list that combines a matrix, a numeric vector of length one and two character vectors. - the
"phylo"class provides R with all the information it needs to represent a phylogenetic tree
Connecting a phylogeny with data from a table
- Preparation:
- Download a data table of the species from the Portal Data base that inlcudes taxonomy
- Save it in your data-raw folder.
- Read it into R with
read.csv(), and assign it to an object calledtaxonomy.
- To join a tree and a data table, we will use the
_join()functions that we used previously to join tables- Mini review; example with
surveysandspecies:species <- read.csv("../data-raw/species.csv") surveys <- read.csv("../data-raw/surveys.csv") intersect(colnames(species), colnames(surveys)) library(dplyr) joined_left <- left_join(surveys, species, by = "plot_id") joined_inner <- inner_join(surveys, species, by = "plot_id") - What is the difference between
left_joinandinner_join?
- Mini review; example with
- To link a tree and a data table, the tree has to be the first argument and the table will be second
- Also, the column that we will be joining by is always
"label" - Make sure there is a “label” column that has some names from your tips in your table
tree_table <- left_join(portal_tree, taxonomy_matched, by= "label") - What is the structure of the object?
- Attention! doing a full join does not work later down the analysis workflow, we need a left join to drop non matches
full_join(portal_tree, taxonomy, by = "label") - We can still plot our tree normally with
ggtree(tree_table) - But now we can use
aestheticsto color some tip labels by a varianle of choice:ggtree(tree, aes(color = taxa, fontface = "italic")) + # it freezes if there are any unmatched or NA labels in data table!!! xlim(0, 20) + geom_tiplab()
Exercise 2: A taxonomy table for small_tree
- Find the appropriate scientific group labels for each genus in
small_treeusing this tree as guide. - Create a data frame with 3 columns:
- a
"label"column with the names of the tip labels ofsmall_tree. Tip: extract the element"tip.label"from your phylo object to get a vector of tip labels that you can then join to the other vectors to create a data frame. - a
"taxa"column with the scientific names of the group that each genus belongs to. - a
"common_name"column with the common names of the group that each genus belongs to. Tip: use the functionc()to create the vectors that will be columns"taxa"and"common_name"
- a
- Join your tree and your table using
left_join(). - Create two different tree plots using
taxaandcommon nameto color the tips of the tree.
Exercise 3: Connecting a tree and a table for your final project
- Connect the data table you chose for your final project to a tree with taxa on your table that you obtained from Open Tree of Life.
- Plot the tree and color the tips following one variable on the data table.
Homework - Exercise 4: Mapping weight data from surveys CSV table to the portal tree (10 min)
- Get the average weight and hindfoot length per species.
- Create a new data frame that contains the taxonomy data plus the averaged data per species that you got on last question.
- Create two plots with data on the tips, one with the average weight and the other with average hindfoot length. Make sure to also add tip labels, formatted in italics.