A) The package ggplot2
Install the R package ggplot2. You can do this by running the function install.packages() from an R environment, as follows:
install.packages("ggplot2")
If the install was successful, you should see something like:
The downloaded binary packages are in
	/var/folders/dx/qk620qcx25dgv4d1rdpkyxmm0000gq/T//RtmpoawwXe/downloaded_packages
B) Visualizing data from tables
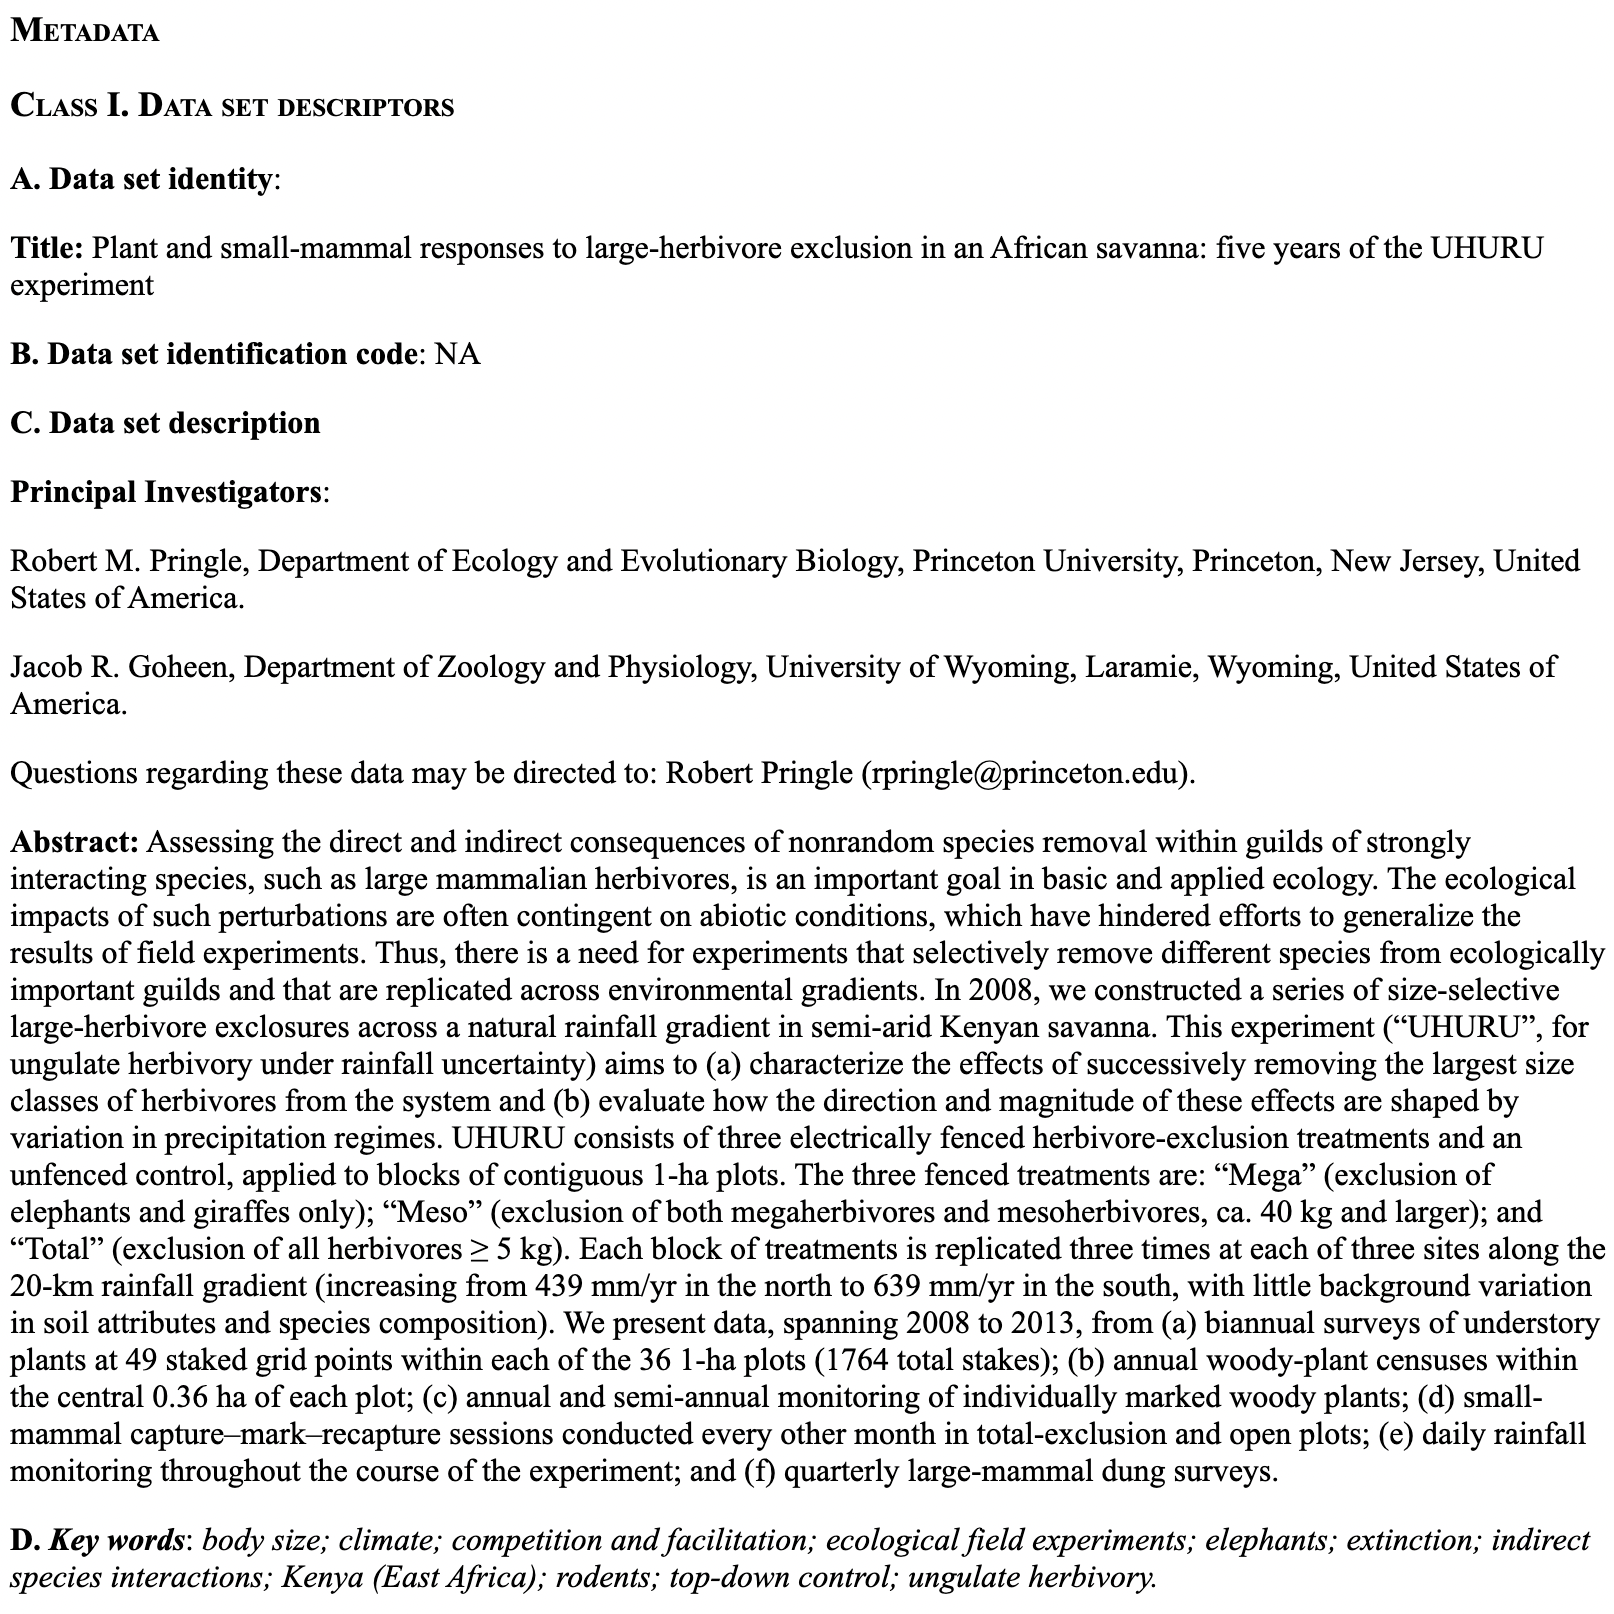
Read the piece below consisting of an extract of the metadata from the data set analyzed in the research paper Plant and small-mammal responses to large-herbivore exclusion in an African savanna: five years of the UHURU experiment, by Kartzinel et al. 2014, published in the journal Ecology, and answer:
- How many Principal Investigators are mentioned in the metadata description?
- What does the term UHURU stand for?
- Where does the experiment take place?
- How many experimental treatments are mentioned in the metadata abstract?

